Appearing in Google’s Top Stories carousel is a great way to gain visibility for news content and drive organic traffic. However, Google doesn’t provide much data on clicks, impressions, or other performance metrics from this feature.
From a technical perspective, the Top Stories carousel is an AI-powered search results feature that showcases relevant and timely articles from a wide range of high-quality, trustworthy news sources.
What Python libraries do you need?
Setting Up the Parameters for the Request
To track results in Google Top Stories, you can use SERPapi, which offers 100 free requests per month—a good starting point for basic tracking. If you need a more in-depth, scalable solution, consider using dedicated tracking tools like StoryHawk.io, which I’m involved with.
To scrape the Top Stories carousel using SERPapi, sign up for a free account. Once registered, copy your API key and paste it into your script.
A handy feature SERPapi provides is the SERPapi Playground, where you can easily test and adjust your query parameters to fit your needs before running the script.
The current example is with the following parameters:
Search engine – Google
Query – “nfl news”
Location – New York
Domain – Google.com
Language – English
Region – US
Device – Mobile
Sending the request to SERPapi
To retrieve Top Stories data from SERPapi, you’ll need to send a request using Python’s requests library. The API response will be stored in the variable response, which will contain the JSON-formatted results.
Filtering and Storing Top Stories Data in a Pandas DataFrame
The first step is to extract only the Top Stories data from the full API response, which contains information for the entire SERP (Search Engine Results Page). We’ll store this filtered data in a variable.
On mobile devices, multiple news carousels can appear, such as Top Stories, close topic (also about ... ), and Also in News. To ensure we're only working with Top Stories, we’ll create a second variable and store the extracted data in a Pandas DataFrame for easier analysis.
Adding More Data to the DataFrame from the API
To enrich the DataFrame with additional details from the API response:
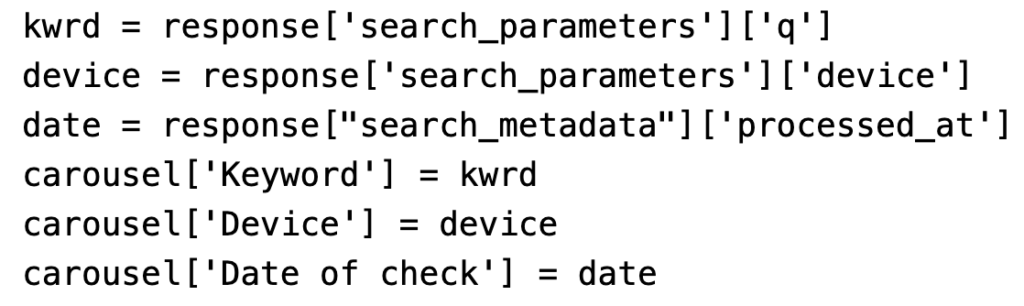
The search query is stored in the "Keyword" column using the variable kwrd.
The device type is stored in a separate variable.
The date and time of the check are recorded in the "Date of check" column.
This ensures that each entry includes essential context, making it easier to analyse trends over time.
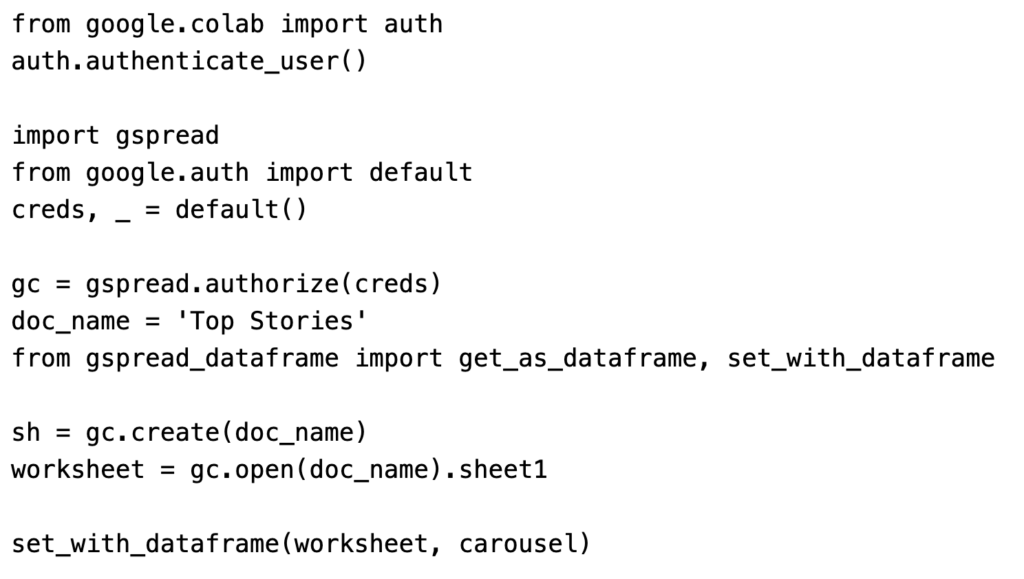
Exporting Data to Google Sheets
You can easily export your Pandas DataFrame to Google Sheets, making it accessible for further analysis or visualisation in Looker Studio. Below is a standard script to do this using Google Colab and the gspread library.
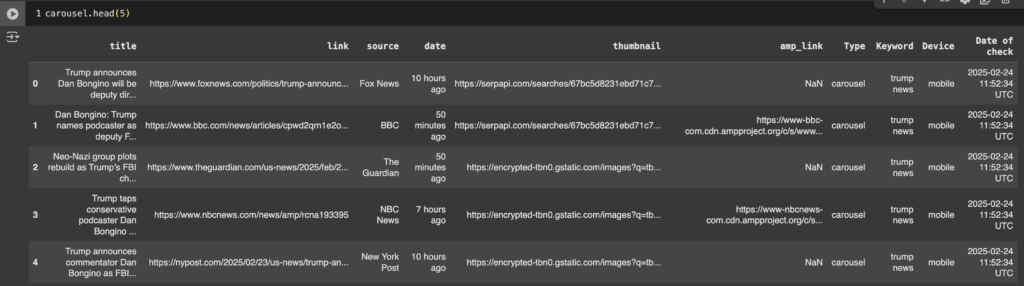
Exported data from the “Top Stories” carousel to Google Sheets
That is how should look your exported dataFrame/table with all needed values from the API for the query "trump news"
You can find this simple script in GitHub and or get in touch with me on X or LinkedIn
Scaling Up with StoryHawk.io
While this manual approach works well for individual tracking, it becomes challenging to scale for large publishers managing multiple news stories across different regions. That’s where StoryHawk.io comes in. Our tool automates Google Top Stories tracking at scale, providing real-time insights, historical performance data, and competitor analysis—all in one place. No need for manual API calls or data exports—StoryHawk.io does the heavy lifting, so you can focus on optimising your content strategy. 🚀
Google is testing “Preferred Sources” in Top Stories, letting users star their favourite publishers.
Visibility is shifting from purely algorithmic to partly audience-driven.
Publishers with strong reader loyalty stand to gain—others risk disappearing from view.
It’s time to rethink what visibility means in search.
I'm a founder of StoryHawk. A tool that can help you measure how valued your content is in Top Stories.
Introduction: A New Definition of Visibility
We’ve long treated visibility in Google News and Top Stories as a game of publishing speed, technical eligibility, and SEO best practice. But Google’s new “Preferred Sources” experiment signals something deeper: visibility isn’t just about what you publish—it’s about who values it.
For news publishers, this isn’t just a feature test. It’s a wake-up call.
Context: What’s Changing in Google Top Stories?
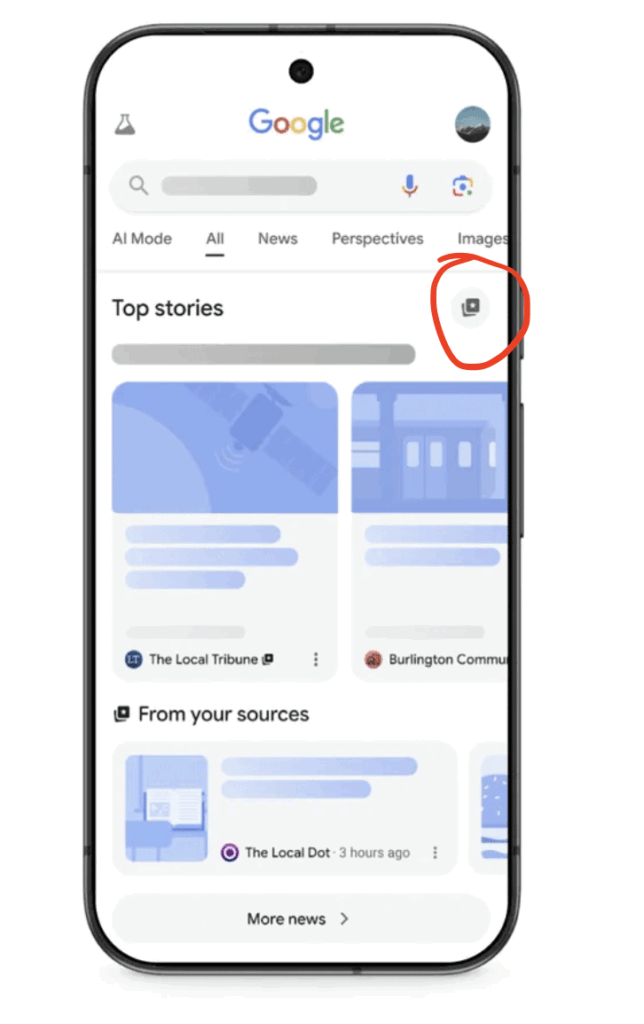
Google is now testing a feature called “Preferred Sources” in Search Labs (US and India). It lets users manually star the news brands they want to see more often in Top Stories. Here’s what that means:
Articles from starred publishers will appear more frequently in the user’s personalised Top Stories carousel.
A new “From your sources” carousel may be displayed alongside the main Top Stories block.
Algorithmic results still remain—but now they share space with user-driven curation
Why This Matters: The Audience Now Shapes the Algorithm
This update marks a subtle but powerful shift: Google is personalising news visibility based on user trust and affinity. That means:
Publishers who have built loyal audiences may see a visibility boost.
Lesser-known or newer publishers may struggle if they’re not being chosen.
It’s not enough to publish frequently or optimise well—you have to be preferred.
In short, Google is testing a hybrid model: a blend of algorithmic authority and audience-endorsed prominence.
The Rise of Reputation-Weighted Visibility
This isn’t an isolated development. “Preferred Sources” is just the latest sign that visibility is increasingly reputation-weighted. Consider:
AI Overviews and passage-level ranking elevate content from known, trusted entities
Brand mentions, authorship, and off-site amplification are becoming indirect ranking factors.
Click-through rates above expected norms (especially in Top Stories) are rewarded algorithmically for writing great content
Google doesn’t just rank content—it ranks belief in that content.
Actionable Tips: How Publishers Can Respond
This shift requires a mindset change from “optimise for Google” to “become valued by your audience.” Here’s what to do:
1. Cultivate Loyalty
Encourage your audience to add you as a Preferred Source (when available). Build relationships via newsletters, branded apps, and social.
2. Build Author Brands
Give your journalists visibility—bios, consistent bylines, social presence. People follow people, not logos.
3. Amplify Early
Stories that earn engagement early—shares, mentions, links—have a higher shot at Top Stories inclusion and Discover amplification.
4. Stand for Something
Generic content blends in. Invest in original reporting, editorial voice, and viewpoints your audience remembers.
5. Track What Sticks
Use tools like StoryHawk to go beyond rankings. Measure what content actually gets visibility, in what format, and why. StoryHawk’s tracking lets you see whether your brand or competitors are becoming “preferred” through actual Top Stories share.
StoryHawk: Helping You See the Bigger Picture
At StoryHawk, we’ve always believed Top Stories visibility is about more than metadata. Our dashboards show which publishers dominate Top Stories, when and where your content appears, and how consistently your brand earns Google’s trust.
As visibility becomes more personal and reputation-led, that kind of insight becomes essential.
Win Hearts, Not Just the Algorithm
The SEO playbook isn’t dead—but it’s no longer enough. Google is listening to users more than ever. And if they’re not choosing you, no amount of AMP, structured data, or Core Web Vitals will save you.
So ask yourself: who values what you publish? And how are you earning that trust?
Because visibility isn’t just about getting seen. It’s about being chosen.
Want to know if your brand is becoming a “Preferred Source”? 👉 Book a free demo on StoryHawk if you want to have a chat with me about your visibility on Google News
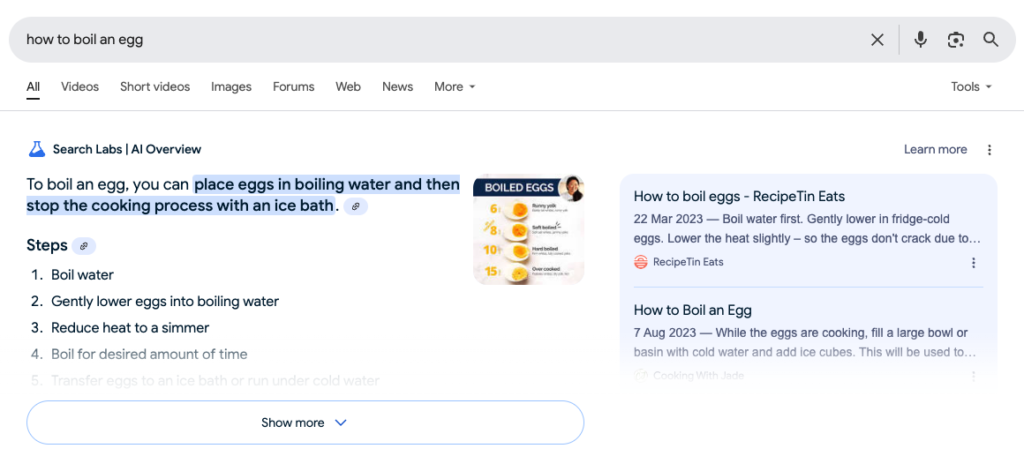
Google’s AI Overview (previously known as "SGE") is changing how search results work. Instead of just showing the regular result page with blue links, Google now provides AI-generated answers at the top of the page.
I wanted to track when and where the AI Overview appears for my target keywords which website is ranking better than ours. So I built a simple Python script using the DataForSEO API (you can find the script at the bottom of the article).
In this guide, I’ll show you exactly how I did it, step by step.
What exactly you'll get from this script as an outcome:
Check if AI Overview appears for a keyword.
Extract sources used in the AI Overview.
Save the results in a CSV file for easy analysis.
Disclaimer
Google does not always show AI Overview to users who are not logged in. This means that the data collected may not be 100% accurate, as it depends on whether DataForSEO's API request triggers an AI Overview at the time of the search but this is an issue for most of the SEO trackers.
To reduce discrepancies, I recommend running the script multiple times and blending the data. This will help you get a more reliable view of where AI Overview appears in search results.
What You Need
Before we begin, here’s what you’ll need:
1. Python installed on your computer
You'll need Python 3.6 or higher. If you don’t have it yet, download it from python.org.
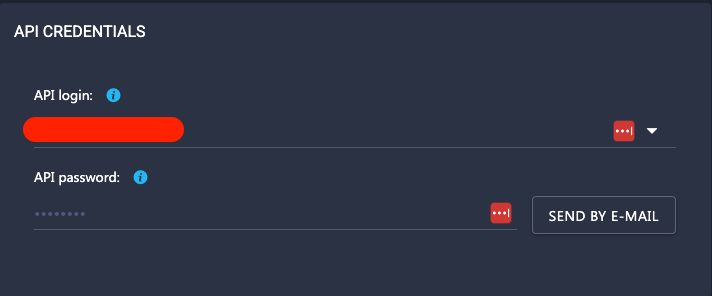
2. DataForSEO API Credentials
DataForSEO provides access to Google SERP data. If you don’t have an account, sign up at DataForSEO and get your API credentials (username and password).
3. Python Libraries
The script uses a few basic Python libraries. You can install them by running:
import requests
import json
import time
import csv
Step 1: Clone the Script
First, download my script from GitHub:
git clone https://github.com/yourusername/ai-overview-checker.git
cd ai-overview-checker
Alternatively, you can just create a new Python file then capy and paste the script into the file.
Step 2: Set Up Your API Credentials
Open the script in a text editor and add your DataForSEO API details:
Replace "your_username" and "your_password" with your actual API credentials.
Step 3: Prepare Your Keywords
Create a CSV file called keywords.csv with a list of keywords you want to track. Each keyword should be on a new line, like this:
broadband deals
cheap mobile plans
how to get an eSIM
Save the file in the same folder as the script.
Step 4: Run the Script
Now, simply run the script:
python check_ai_overview.py
The script will: 1. Send a request to DataForSEO for each keyword. 2. Check if AI Overview is present. 3. Extract the references used in AI Overview (source, domain, URL, title, and text). 4. Save everything in a CSV file.
Step 5: View the Results
The results will be saved in a file called ai_overview_results.csv. It will look something like this:
Now, you can track which keywords trigger AI Overview and which sources are being used in AI-generated answers.
How It Works
Here’s a quick breakdown of what the script does:
Reads keywords from the CSV file.
Sends requests to DataForSEO API to check Google SERP results.
Checks if AI Overview is present in the response.
Extracts all the sources used in the AI Overview.
Saves everything into a CSV file for analysis.
To avoid API rate limits, I’ve added a 2-second delay between requests. If you're tracking lots of keywords, you might want to adjust this based on your API limits.
Final Thoughts
Tracking Google AI Overview is essential if you want to understand how Google’s AI-generated results affect SEO and what content is likely to appear. This simple Python script makes it easy to check for AI Overview, track the sources used, and adjust your SEO strategy accordingly (as much is possible).
Ideas
If you want to improve this script, you could:
Schedule it to run daily and track AI Overview over time - You can put the script on Google Cloud and store the data on BigQuery, instead of CSV. This will allow you to store more data and to connect with Looker Studio for better visualisation.
Store the results in Google Sheets instead of CSV - It's a really quick win if you use Google Colaboratory to add a couple of lines and to export the data on Google Sheets instead of CSV, which again will allow you to connect the data with Looker Studio again.
Visualise the data to see trends in AI Overview appearances.
In recent years, the news publishing landscape has undergone significant change, with more publishers turning to subscription models to monetise their content. For those yet to embrace this approach, the question is no longer "if," but "when."
More and more publisher are choosing this type of mentisation:
As of 2024, the leading news publishers by digital-only subscribers are:
The New York Times: 11 million digital subscribers.
The Wall Street Journal: 4.25 million digital subscribers.
The Washington Post: 2.5 million digital subscribers.
The Telegraph: 1.5 million digital subscribers
Substack: 2 million paid subscriptions across various newsletters.
Note: These figures are based on the most recent available data and may have changed since their publication.
However, implementing a paywall is far from straightforward. Simply adding a subscription form to a website is rarely enough. Success requires a well-thought-out strategy that carefully considers the interplay between a site’s traffic and how Google will crawl your website.
In this article, I’ll explore the different types of paywalls and their impact on organic traffic.
Types of Paywalls
When it comes to setting up a subscription service, publishers have several options on how to restrict content to their audience. Let’s look at the common ones:
Hard Paywall
A “hard” paywall means that you can’t see any of the content unless you pay first. This might make it tougher to get people to buy because they can’t try it out for free like they can with a “soft” paywall. However, if the content is really special or different in a way that people can’t find anywhere else, they might be willing to pay for it right away.
Example of a hard paywall
The Financial Times (FT) employs a hard paywall model, requiring readers to subscribe before accessing its content. This approach restricts all online material to subscribers, aiming to provide exclusive, high-quality journalism to its paying audience.
Initially, the FT introduced a paywall in 2002 and later adopted a metered model in 2007, allowing limited free article access before prompting for a subscription. However, in 2015, the FT transitioned to a hard paywall, eliminating free article allowances and requiring a subscription for full content access.
Freemium paywall
A Freemium model is when a website (or app) provides some content for free but charges for more detailed or advanced stuff. Publishers who use this approach give you simple articles at no cost, and then if you want more in-depth or special features, you have to pay.
Example of freemium paywall
A notable example of a freemium paywall is employed by The Verge, a technology news website. In December 2024, they introduced a subscription service that maintains free access to their core content—such as news posts, Quick Posts, Storystreams, and live blogs—while placing original reporting, reviews, and features behind a metered paywall. This approach allows readers to access essential content for free, encouraging engagement, while offering premium content to subscribers.
This freemium model effectively balances accessibility with monetisation, providing value to both casual readers and dedicated subscribers.
Metered Paywall(Recommended by Google)
A metered paywall lets you see some content for free for a little while or a few times before you have to pay. Usually, this limit resets every month. Lots of news publishers do this. They might let you read 5 articles for free each month and then ask you to pay if you want to read more. Software companies (SaaS) also use metered paywalls for their subscriptions. For example, your subscription might let you download 20 reports each month. Once you hit that number, you need to pay if you want more.
People often mix up “soft paywall” and “metered paywall,” but they’re not exactly the same. A “soft paywall” typically means there’s a special part of the website with extra good content that you need to pay for, while a “metered paywall” means you can see a certain amount of content before you have to start paying.
Smart Matering Paywall
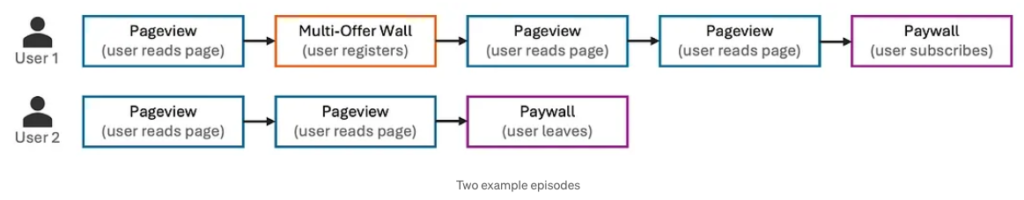
Metering can be seen as a Reinforcement Learning (RL) problem, where an agent learns to take actions in a changing environment to earn the highest total rewards over time. Unlike traditional machine learning, RL adapts to changes caused by the agent’s own actions. It has been used in areas like robotics, gaming, and self-driving cars. In this case, the “metering agent” makes decisions based on the user’s behavior and the content they are trying to access. The agent can choose from three actions, and each choice gets a reward based on how the user reacts. A user’s journey, called an episode, continues until they subscribe or stop accessing content. The goal is for the agent to take the best actions at each step to get the highest overall reward.
The Washington Post employs a metered paywall model, allowing readers to access a limited number of articles for free each month before requiring a subscription for further content. This strategy enables casual readers to engage with the site while encouraging frequent visitors to subscribe for unlimited access.
In addition to the metered paywall, the Washington Post utilizes a pop-up, anti-scroll feature that prompts users to subscribe after reaching their free article limit. This approach includes form fields and offers various subscription options to cater to different reader preferences.
Lead-in (Recommended by Google)
This method is like a strict paywall. You get to see the title and the first bit of the article, maybe the first paragraph or 100 words (it’s up to the published how much will show). It’s a middle ground that lets you check out how good the article might be without giving you the whole thing for free.
Even though this is okay with Google’s rules, it can annoy people who click on the article from a search and then leave right away because they can’t read the whole thing without paying.
Example of lead-in paywall
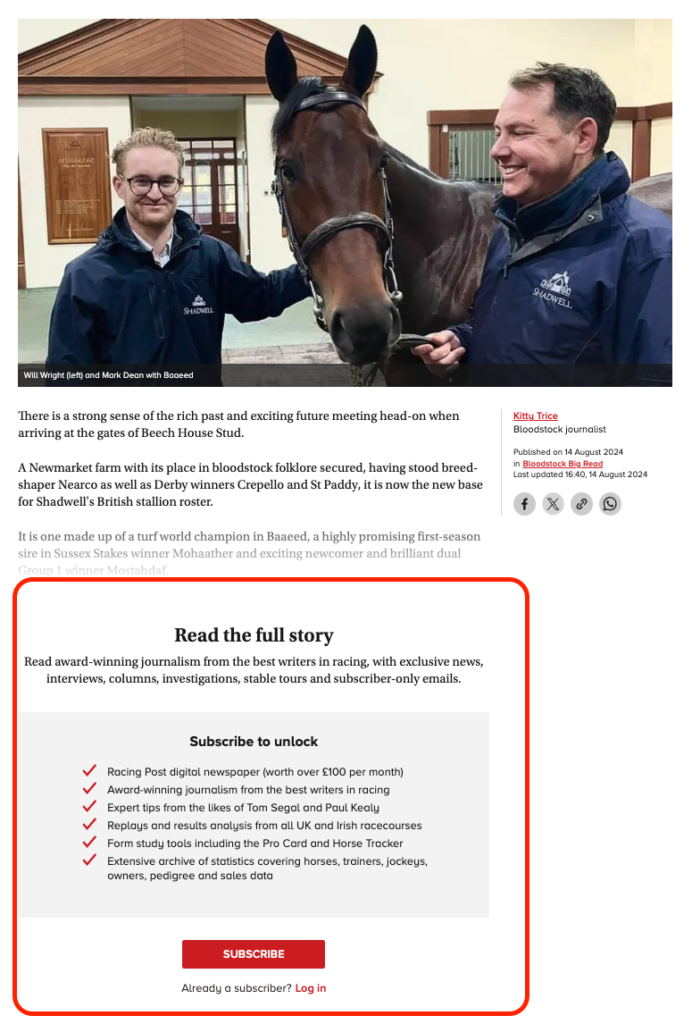
In 2022, I led the technical SEO and website migration for Racing Post as they transitioned from a hard paywall to a lead-in paywall.
Racing Post publishes their tips behind the paywall, and thanks to the flexibility of Next.js, the paywall is rendered server-side. This ensures that users cannot bypass the paywall by disabling JavaScript (JS) in their browsers.
Dynamic Paywall
Dynamic paywalls use what they know about each reader to offer a more personal experience. They look at what you do, what you’re interested in, and how you interact with their content to figure out the best way to get you to subscribe. This is really helpful for news publishers because it lets them see what their readers like best, how often they visit, and even what devices they use.These smart paywalls are all about the reader. They’re not just a one-size-fits-all barrier; they adapt to what you seem to want and need. So, if someone’s really into the content and likely to subscribe, the paywall will notice and adjust the number of free articles they get to see before asking them to pay. This way, it tries to turn more readers into paying subscribers by only asking for a subscription at the perfect time.
Each type of paywall has its own way of balancing reader access with revenue goals, and the choice depends on what fits best with a publisher’s content strategy and their understanding of the audience’s reading habits.
Google doesn’t automatically dislike content that you have to pay to access. It’s fine with this kind of content as long as the website tells Google that it’s behind a paywall.
Publishers who use paywalls aren’t left out of Google’s search results. Their content that’s only for subscribers can still show up on various surfaces, like the Top Stories carousel, Aslo News, Google News, Discover, and the regular list of search results.
IMPORTANT: publishers must set up their paywalled content so that Google can look at it. This way, Google can include it in search results and use the right factors to decide how well it should rank.
Paywall implementations and their SEO impact
Different technical setups can influence how well a site with a paywall performs in search rankings. Here’s a rundown of various implementations and how they might affect a site’s visibility in search results:
Structured Data
isAccessibleForFree
First, you have to make sure Google knows when an article is behind a paywall so it won’t confuse your paywall with something sneaky like cloaking.
You do this by using structured data for news articles. When you set up the structured data for an article that’s behind a paywall, you have to specify that it’s not free. You do this by setting the “isAccessibleForFree” attribute to “false,” which tells Google that the article is either fully or partially paywalled.
Usually, news publishers mix both free and paid content. The value of the “isAccessibleForFree” item is a boolean so if the content is for free the value should be “TRUE” and if the content is paid – “FALSE
hasPart
By putting the “hasPart” item into your NewsArticle structured data, you can show where the paywall begins. You do this with the “cssSelector” attribute, which should have the CSS class from your article page that marks where the paywalled content starts.
NOTE: "hasPart" is not a required, it's just recommended.
Googlebot verification
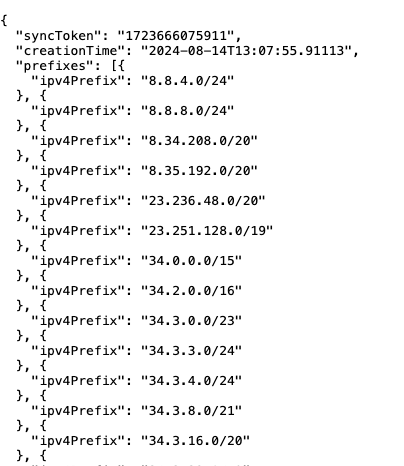
By verification of Google and their crawler, Google will be able to crawl and index your content, including the paywalled sections. There are a couple of option to verify and differentiate Googlebot and a regular user.
IP verification – Fortunately, Google provides a JSON with the IP addresses it uses to search the internet. This makes it easy and safe to check if a visitor is actually Google and decide what kind of content to show them on the website.
I developed a Googlebot IP Verification tool, where you can check a single IP if it's a Google's one or another crawler.
User-Agent Paywall – When you have a paywall that checks the type of browser, your website shows different things to regular visitors and to Google. Normal visitors see a version of the website that asks for payment to access content, without any free parts. But when Google’s web crawler visits, it sees a version with the full article and all the detailed information it needs to list the article in search results. The downside of this is that the content won’t be protected on 100% from scrapers because the User-Agent is easy to be manipulated.
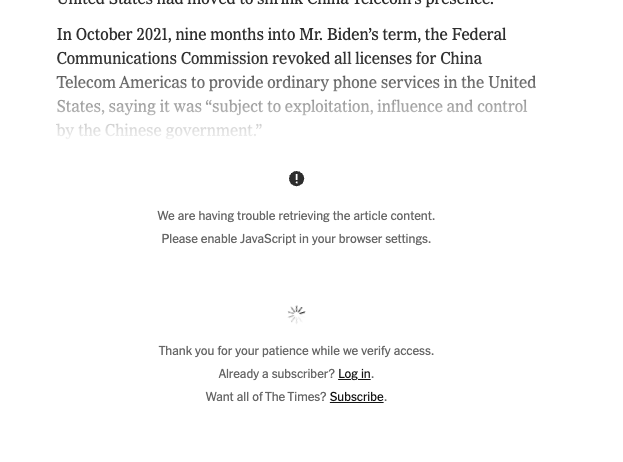
JavaScript Paywall – This method verifies the user on client-side (in the browser) by JavaScript. The webpage HTML document contains the full article, and based on where is coming the request the JS can hide the paid content and show the barrier. Googlebot is crawling all pages first without executing the JS and is parsing only the HTML document, that’s why with good server-side rendering(SSR) this won’t be an issue for news publishers. The benefit of this is the flexibility that the JS provides to optimise for conversion but at the same time by just disabling the JS in the browser the content will be accessible. The downside of this Googlebot verification is that the content still isn’t fully protected. By disabling JavaScript (JS) in a browser or crawler, the content can be accessed for free.
Based on my experience the best way and the most secure is by cross-checking the user-agent and the IP of the request. If the publisher is more conversion-oriented oriented I would suggest a JavaScript paywall because of the flexibility.
At the same time, monitor sessions where JavaScript (JS) is disabled. If these sessions increase, appropriate actions should be taken, similar to what The New York Times has done. In my opinion, The New York Times implemented a smart solution to prevent access for sessions without JavaScript enabled.
No Archive tag
Search engines like Google might save a copy of your web pages. This saved version is called a “cached” page. Google can show a link to this cached page in its search results, which allows people to see the content of the page even if the original page is not available anymore.
If you don’t want Google to save and show a cached copy of your pages, you need to tell Google not to do this. You can do this by setting a rule on your website. If you don’t set this rule, Google might save a copy of your page and people could find and view this saved version by clicking on the “Cached” link in Google’s search results. This means that even if you have a paywall or special content that you only want paying users to see, they might still see it for free through the cached link.
HTTP header
HTTP/1.1 200 OK
Date: Tue, 25 May 2010 21:42:43 GMT
(…)
X-Robots-Tag: noarchive
(…)
SEO Debugging for Paywalls and Subscription-Based Content
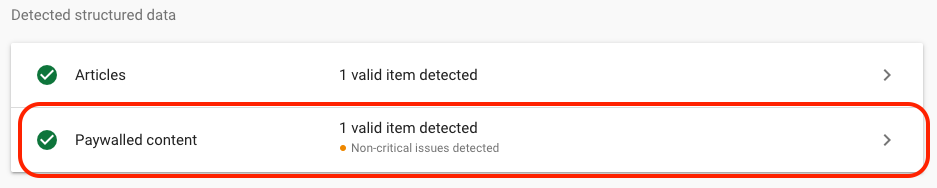
Google’s Rich Results Test(RRT) has been upgraded to show you the validation of structured data for paywalled content. From October 2023 the tool shows if that site is using the proper structured data for paywalled content or not.
Structured data debugging - you can submit a URL and to check if your structured data is correctly implemented. If you have "isAccessibleForFree" you should be able to see
Paywall barrier debugging - RRT is providing a screenshot of the article which previously was way smaller than now but Google has expanded in the past. If the paywall and the Googlebot verification is implemented well, you should be able to see the page without any paywall barriers. NOTE: If you are using User-Agent verification I would recommend to add also the Googlebot user agent Google-InspectionTool
What are the potential downsides of setting up a paywall?
Different (poor) user behavior
User experience is a ranking factor and I believe that part of this is how often users click on the “Back” button and return to the search results page (SERP) after visiting a site. If users frequently go back to SERP quickly, it’s a bad sign for the site, suggesting the content didn’t meet their needs.
Websites with high ‘return to SERP’ rates might rank lower on Google over time. Google aims to provide the best search results, and sites that users quickly leave don’t fit the bill.
The real SEO challenge with paywalls is that they can increase ‘return to SERP’ instances, leading to less visibility on Google.
To counter this, publishers can use ‘First Click Free’ tactics or wisely set paywall limits for users from Google, letting them read full articles and reducing ‘return to SERP’ events to avoid long-term SEO harm from paywalls.
Lower CTR than the average
During the NESS conference in 2022, SEO experts from The Times reported a decrease in click-through rates (CTR) as users became aware that the website’s content was behind a paywall, leading them to avoid clicking on the search results.
Based on my experience with paywall content the proportion between free content and paid content should monitored and it’s a good option {again} to implement “First Click Free” which will minimise this routing of the users.
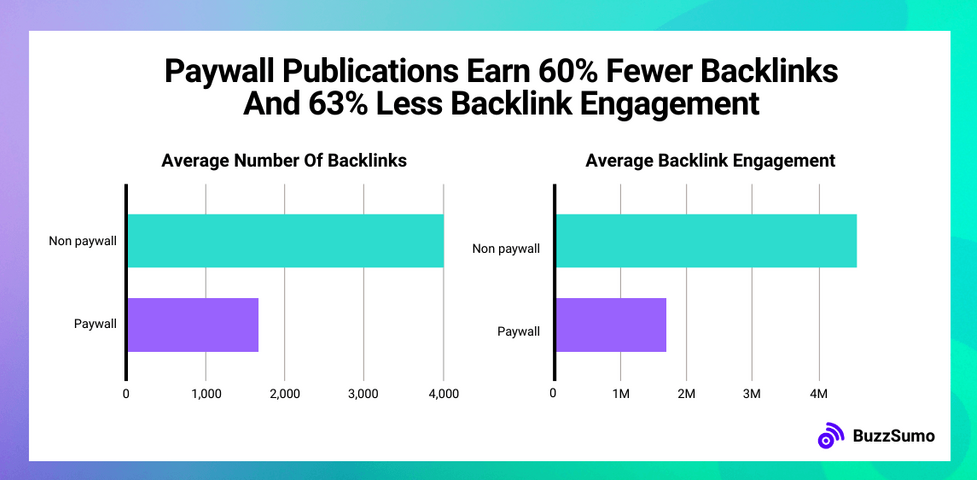
Fewer backlinks
Websites operating behind paywalls often experience a reduction in backlinks because their content is inaccessible to a wide audience. This observation aligns with the findings presented in BuzzSumo’s case study, “We Analyzed Millions Of Publisher Links. Here’s How To Syndicate Your Content & PR For Free” which provides insights into effective strategies for content syndication and public relations without incurring costs.
My opinion as a tech SEO expert
Paywalls are becoming more popular but at the same time more complicated. They can help make publishers monetise their content but at the same time the implementation should follow the SEO requirements and to be based on the user experience and behavior and avoid any damage.
I would recommend the following implementation:
Use Machine Learning to make your paywall as smart as possible and serve the barrier only on your best users
Analyse the conversion after the implementation and remove the paywall on the channels that are not performing that well. (i.e. Google Discover)
A Google News XML sitemap is a special type of XML file that helps Google News find and index news articles more efficiently. It includes key details like the headline, publication date, author, and the article’s URL. Unlike a regular XML sitemap, which lists all website pages, a Google News XML sitemap only includes articles published in the last 48 hours. Submitting one to Google makes it easier for your news articles to appear in Google News search results.
Why do we need to monitor the competitors’ Google News XML sitemap?
Monitoring or scraping competitors’ Google News XML sitemap can provide valuable insights into their content strategy and help identify potential opportunities for improving your own website’s visibility in Google News. Here are some reasons why monitoring competitors’ sitemaps is important:
Discover new content ideas: By analysing competitors’ sitemaps, you can identify the topics they are covering and find new content ideas that you can incorporate into your own website.
Track trends: Monitoring competitors’ sitemaps can help you stay up-to-date with the latest news and trends in your industry, and enable you to adjust your content strategy accordingly.
Identify gaps: Analysing competitors’ sitemaps can help you identify areas where your website is lacking in coverage, and enable you to fill those gaps with relevant and engaging content.
Analyse published frequency: This data could give you information about how often the competitor is publishing and what topics are covered the most.
Overall, keeping an eye on competitors’ Google News XML sitemap can provide valuable insights about their strategy on Google News and Google Discover
If you are interested in monitoring the Google “Top Stories” carousel, please check my previous blog post:
Advertools – This is a Python package that provides a wide range of tools and utilities for data-driven advertising and is the best one for digital marketers(SEOs). It is designed to make data analysis and reporting easier for marketers and advertisers by providing a set of functions that automate common tasks and streamline workflows.
Time – Python has a built-in module called “time” that provides various time-related functions. We will use it for postponing the script.
Pandas
SSL
STEP 1: XLM sitemaps to data frames
The code above runs forever and keeps calling a function called sitemap_to_df from Advertools. This function helps you get an XML sitemap from a URL and save it as a variable.
Usually to find the Google News XML sitemap of the competitor you can check for a refferel link in the robots.txt file.
NOTE: However, there’s a problem with the max_workers argument being used. It could cause unnecessary network traffic and slow down your computer because the same URL is being accessed and processed repeatedly without any break.
To avoid this issue, add a delay using time.sleep() at the bottom of the script.
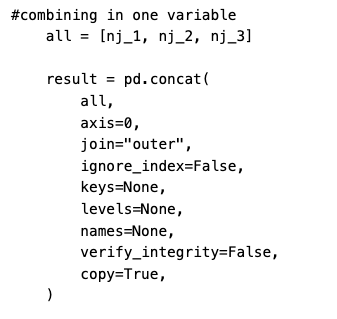
STEP 2: Combining the data frames in one variable
The next step is to create a list called “all” that holds all variables likely to contain data obtained from processing different XML sitemaps. I decided to make this list to make it easier to work with the data together.
STEP 3: Removing the duplicates and keep the first one
Google News XML sitemap contains only the articles published for the last 48 hours. If you are scraping it more frequently you are likely to have duplicated values. That’s why the code line above removes all duplicates in the column “loc” (URLs) and keeps the first one.
STEP 4: Exporting the data into a CSV file without headings
I created separate variables for each sitemap that was crawled, and then we combined them all into a single variable called “result”. To save this data, we need to export it to a CSV file. Since we want to keep adding to the file every time we run the loop, we use the “mode” mode “a” which appends data without altering existing content.
Furthermore, to avoid having the column names repeated as headers every time we write to the CSV file, we use the “header” parameter to add a header row only if the DataFrame is empty and skip it otherwise.
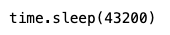
STEP 4: Automated running the script
The code lines “while true” and “time.sleep(43200)” pauses the execution of the program for 43200 seconds, which is equivalent to 12 hours. This is useful for introducing a delay between iterations of a loop or for scheduling a process to run at a specific time in the future.
You can adjust the frequency of the execution:
Hours
Seconds
6 hours
21600
12 hours
43200
24 hours
86400
48 hours
172800
Summary
In summary, this script uses the Advertools library to crawl and extract data from multiple XML sitemaps, store the data in Pandas DataFrames, and then write the data to a CSV file. The script consists of an infinite loop that calls the sitemap_to_df function to obtain data from sitemaps, combines the data into a single DataFrame, and appends it to a CSV file.
Overall, this script provides a powerful way to extract and store large amounts of data from multiple sitemaps in an organised manner. However, it is important to use it responsibly and not overload the server or computer resources. You can easily analyse and visualise this data in Looker Studio Reporting.
You can find the full script on my GitHub account: SCRIPT
NOTE: The time.sleep(43200) function is working only on a local IDE (PyCharm) and it doesn’t work on Google Collaboration
As an SEO specialist, you are probably often asked about what would be the organic traffic that you will receive from some new page or new vertical.
That is why I decided to speed up the process of getting the estimation of expected organic traffic using basic Python automation.
I used a calculation that every SEO expert would easily understand and probably already knows. The script uses the current position of each keyword, avg. search volume and the CTR to calculate the expected organic traffic.
However, remember that this is just an estimation the actual traffic you are going to receive depending on many other different factors and SERP features.
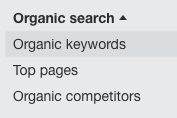
What do you need to run the script? Export of the “Organic keywords” report from Ahrefs – choose the data for the specific URL or subfolder that you are targetting.
import pandas as pd
import numpy as np
from google.colab import files
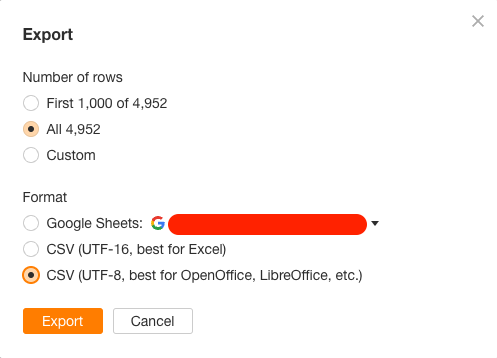
Then you have to upload the exported file from aHrefs > Organic Keywords report.
files.upload()
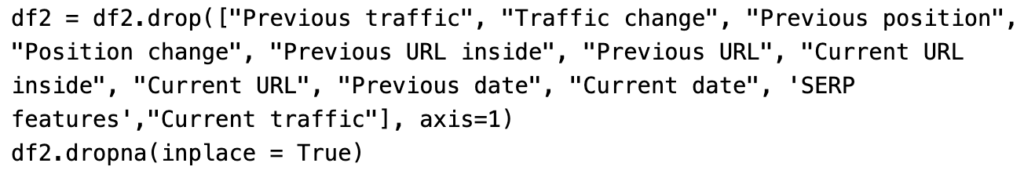
The third key moment is to copy the name of the file and paste it here. Then the additional columns that are not needed will be removed.
Setting the improvement in the positions
The improvement has to be set up in the beginning and stored in different variables. scenario_one will keep the number of positions that you want to improve the ranking in scenario one.
Example: If you are calculating the traffic of your competitors, in scenario one you can increase the positions by 1 point and calculate the traffic if you outrank your competitor.
With df2.dropna, you are removing the keywords with a missing current position. These keywords are out of the top 100, most often keywords that are irrelevant and we should not add to the calculation.
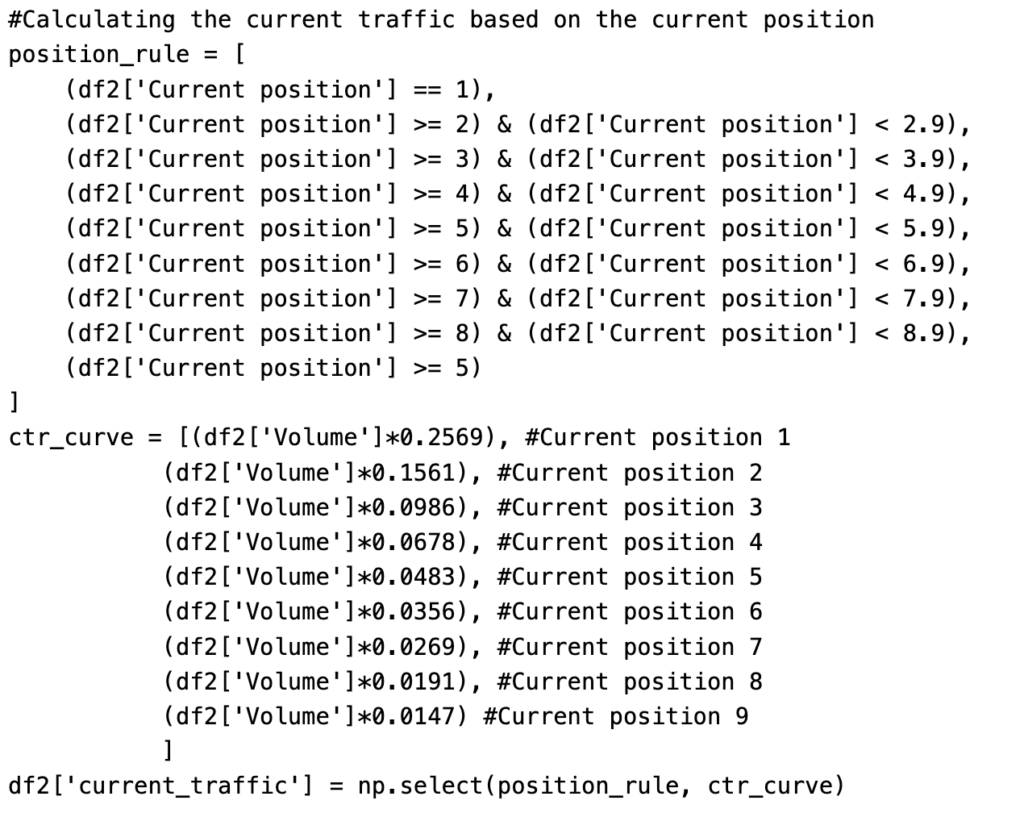
Calculating the current organic traffic
The ‘current_traffic’ is calculated based on two conditions – keyword position and CTR. Where the CTR is dependent on the current position.
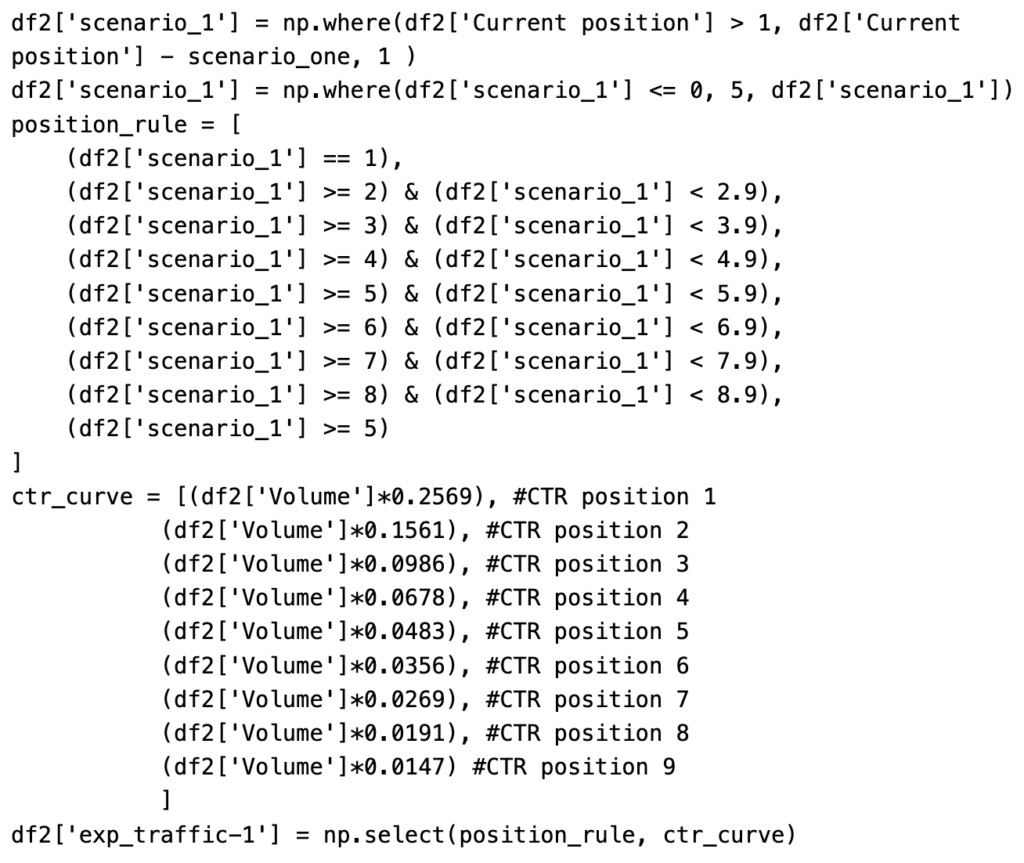
Calculating the expected traffic for scenario number one
Based on the value stored in the variable “scenario_one” the following part of the script will change the current positions and will calculate the expected traffic based on the new positions.
Note: If the value of the position is under 0 will be replaced with 1, automatically.
Calculating the expected traffic for scenario number two
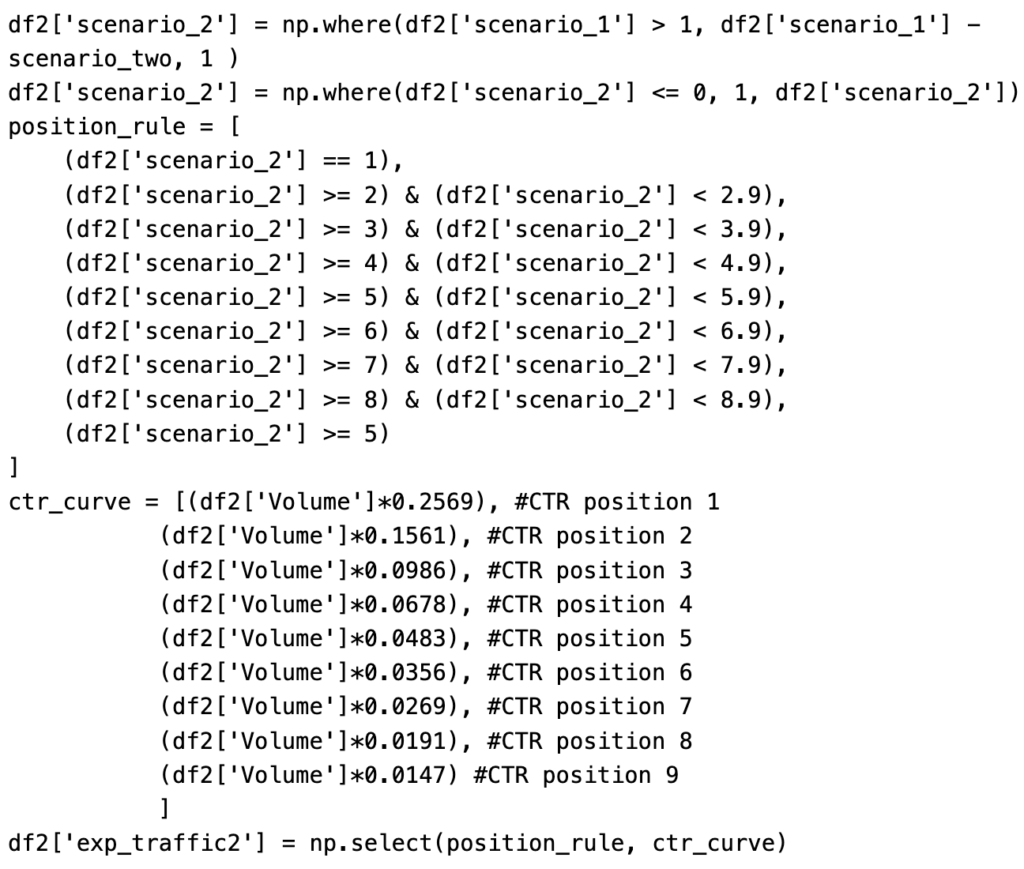
Similar to the previous part, here, based on the value stored in variable “scenario_two” the following part of the script will change the position in scenario one with the improved position and will calculate the expected traffic based on the new positions. The result of the calculation will be stored in column “exp_traffic2”
Note: If the value of the position is under 0 will be replaced with 1, automatically.
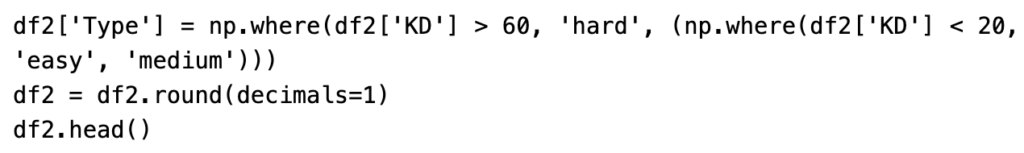
Basic Keyword segmentation based on Keyword Difficulty(KD)
On purpose I kept the columns Cost-Per-Click(CPC) and the Keyword Difficulty(KD) and based on the KD, I categorised the keywords into three categories – Easy (<20), Medium, Hard(>60).
With the current manipulations, the table should look like this:
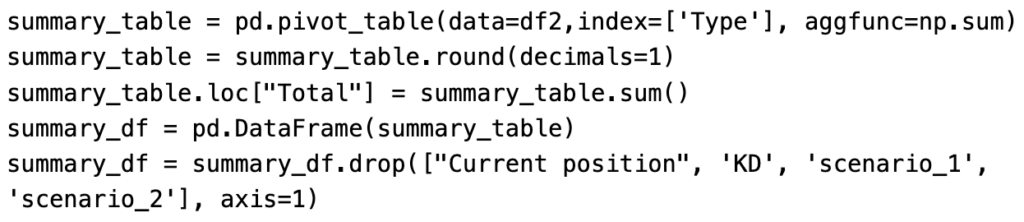
Analysing the expected traffic
This simple analysis is done by creating a pivot table with an index of the type/category of the keywords and the sum of the values. For better understanding, I added also the “total” in a separate row.
Also, I remove the unnecessary columns, such as the current position, KD, and the positions from scenarios one and two.
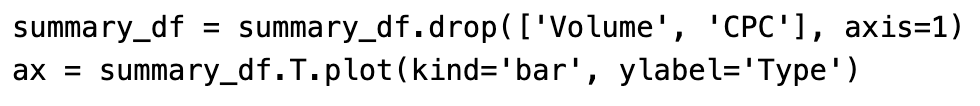
Visualisation
As a final output, I created a bar chart with the current traffic, and the traffic from both scenarios divided by category.
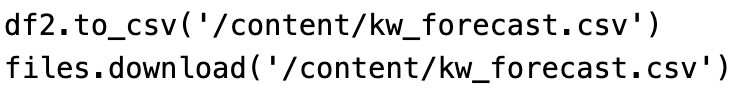
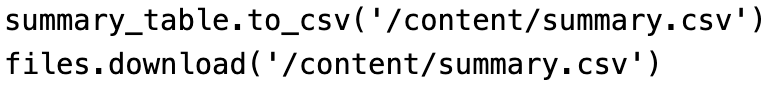
Downloading the data
As a final step, I added a few lines with which you can download the raw data with all keywords and also the pivot table with the summary.
Downloading in a CSV format the raw data.
Downloading in a CSV format the pivot table with the results
This analysis will help you to get an overview of organic traffic on a specific page and subfolder of your competitor. The numbers are rough because of the many factors and fluctuations in the CTR, based on the features in the SERP, market, intent, etc. However, you can identify opportunities based on the expected traffic from not the competitive keywords.
CTR curves are important for understanding how well your website is performing on search engines on the different positions. CTR depends on the position on the search result page, as well as the other features Google is showing for the specific query and intent. By visualising and calculating the CTR per position with your own Google Search Console data, you can understand what is the highest CTR and use it for a forecast. Also, it’s a great way to measure your website’s visibility and effectiveness.
In this blog post, I will show you how to create a CTR curve using Python. I will use data from Google Search Console, which provides the most reliable CTR and average. position for each query.
CTR, short for Click-Through Rate, is a metric that measures the percentage of people who click on your website’s search results. CTR is calculated as follows clicks ÷ impressions = CTR
Analysing CTR Curves for Website Performance
By studying CTR curves, you can gain valuable information about your website’s performance and identify areas for improvement. They help you understand how well your website is capturing the attention of search engine users and guide your SEO strategy. Also, you can use this CTR curve to forecast your organic traffic based on your keyword research.
Step-by-step guide on how to create a CTR curve with Python with data from Google Search Console
Step 1: Importing the Required Libraries
To begin, I import the necessary libraries for data manipulation, visualisation, and statistical analysis:
import pandas as pd
import matplotlib.pyplot as plt
from scipy import stats
import numpy as np
Step 2: Loading and Preparing the Data
To run the script you have to do an export from Google Search Console. The script loads the CTR data from a CSV file with the name “Queries.csv” which is in the .zip file from GSC using the Pandas library:
data = pd.read_csv('Queries.csv')
Next, the “CTR” column is converted from a string to a numeric type and scaled to a value between 0 and 1:
To ensure accurate analysis, the script filters out branded keywords with REGEX. The branded keywords have with really high CTR and will mess up the data.
Note: Make sure that you add all different variations of your brand name.
data = data[~data['Top queries'].str.contains('brand|bra nd|the brand', case=False, na=False)]
Furthermore, I refined the data by filtering for positions 1 to 15.
data = data[data['Position'].between(1, 15)]
Step 4: Calculating the Average CTR by Position
I group the data by position and calculate the average CTR for each position:
The average CTR by position is saved to a CSV file for further analysis or reporting. This is a CSV file with the CTR for each page between 1 and 15 which you can use to analyse and forecast potential organic growth.
The script creates a sequence of x-values and calculates the corresponding y-values for the regression line. The regression line is then added to the scatter plot:
x = np.array(avg_ctr_by_position.index)
y = intercept + slope * x
ax.plot(x, y, color='red', label='y={:.2f}x+{:.2f}'.format(slope, intercept))
Step 9: Finalising the Plot
The remaining lines of code add labels, a title, a legend, and grid lines to the plot before displaying it:
As someone who’s always eager to improve my SEO skills, a few years ago I came across the powerful and incredibly useful concept of regular expressions, or “regex” for short. By incorporating regex into my workflow, I can create intricate search strings, match partial phrases, and use wildcards or case-insensitive searches.
Diving into regular expressions can seem daunting at first, as it’s like learning a mini programming language. However, the time spent grasping the basics is an investment that pays off immensely in the long run. With a solid understanding of regex, I can optimise my website’s content and uncover valuable insights from data extraction, ultimately boosting its search engine rankings and overall performance.
During my exploration of regex, I came across numerous practical use cases that showcased its relevance and effectiveness in the SEO domain. In fact, it has become one of my top tools for enhancing my website’s visibility and analysis capabilities. By sharing my experiences and findings, I hope to help fellow SEO enthusiasts tap into the potential of regular expressions and elevate their skills to new heights.
Understanding Regex for SEO
Basic Concepts of Regular Expressions
In my journey through the world of SEO, I’ve discovered that regular expressions (or Regex, for short) can be a powerful tool to improve my search strategy. Essentially, Regex is a means of matching strings (text) by creating expressions that consist of characters and metacharacters. It’s straightforward to learn and can yield amazing results in my SEO career.
As I started grasping the fundamentals of Regex, I learned a few basic concepts. For example, I came across several metacharacters, which each have a specific meaning:
Character
Description
. (dot)
Matches any character except a newline.
^ (caret)
Matches the beginning of a line.
$ (dollar sign)
Matches the end of a line.
* (asterisk)
Matches zero or more occurrences of the preceding character.
+ (plus sign)
Matches one or more occurrences of the preceding character.
? (question mark)
Matches zero or one occurrence of the preceding character.
Importance of Regex in SEO
The use of Regex in SEO is significant, as it gives me more control over my data and helps to refine my search strategy. I can filter out unnecessary information, enabling a more focused approach to my work.
For instance, I found that Regex can be employed to perform tasks like:
Data extraction from websites: By using Regex patterns, I can extract valuable information from website pages and utilise the data to enhance my SEO tactics.
Log files analysis: With Regex, I can analyse server log files more effectively and identify essential information like crawl errors, which informs me about any issues that require attention.
URL rewriting and redirects: Creating regular expressions in .htaccess files can streamline URL structure adjustments, facilitate navigation on my website, and improve my website’s SEO overall.
In conclusion, learning Regex and incorporating it into my SEO work drastically enhanced my skills and efficiency. By understanding the basic concepts and recognising the importance of Regex in SEO, I’m better equipped to tackle various SEO challenges and make smart improvements to my site.
When it comes to URL rewriting and redirections, I often find it beneficial to use regular expressions (regex) for managing complex patterns. Regex allows me to match specific parts of URLs and easily create rules for rewriting or redirecting them. For instance, I can create a rule that matches URLs with specific parameters and rewrite them in a more SEO-friendly format, or redirect them to a new URL structure. This not only improves my website’s overall crawlability but also helps maintain a clean and organised site architecture.
SEO Audit and Data Analysis
As an SEO professional, I frequently work with large sets of data, such as backlink profiles, keyword lists, and site audits. Regex comes in handy while sorting, filtering, and analysing this data. For instance, I can use regex to create custom filters in Google Sheets to identify patterns in URLs, titles, or meta descriptions. By leveraging regex in my data analysis, I can quickly detect issues, like duplicate content, missing tags, or broken links, and make informed decisions about optimising my website.
Google Analytics and Google Search Console
I also find regex extremely useful when working with Google Analytics and Google Search Console. By employing regex, I can create advanced filters and segments for my data analysis that allows me to focus on specific traffic sources, behaviours, or metrics relevant to my SEO strategy. For example, I can filter organic search queries with certain keywords, analyse the performance of different page types, or identify valuable referrers and harmful backlinks. Implementing regex into my SEO tools helps me gain better insights and uncover hidden opportunities for optimisation and growth.
In conclusion, implementing regex in my SEO activities has significantly improved my ability to manage URLs, conduct thorough audits, and analyse data effectively. The power and flexibility of regular expressions make them an indispensable tool in my SEO toolkit, allowing me to take control of my website’s performance and make data-driven decisions for continued success.
Regex Best Practices
As an SEO enthusiast, I’ve found regular expressions (regex) to be incredibly useful in various situations. In this section, I’ll share some best practices for using regex effectively.
Testing Regular Expressions
Whenever I’m crafting a regex pattern, it’s important for me to test it before implementing it in my SEO or data extraction tasks. This helps me ensure that the pattern matches the desired results accurately and prevents any unexpected surprises. There are plenty of online tools available for testing regular expressions, such as Regex101. I also recommend double-checking your expressions with sample data or logs, to ensure that they’re working as intended.
Performance Optimisation
Another aspect to consider when using regex is performance. Complex regex patterns can be slow and consume considerable resources, especially when processing large amounts of data. Here are some tips I follow to optimise the performance of my regex patterns:
Be specific: The more specific I am with my regex pattern, the faster it can execute. It’s better to use explicit characters or character classes rather than relying on wildcards.
Avoid excessive backtracking: Backtracking can slow down the execution of my regex pattern, so I try my best to minimise it. This can be achieved by using non-greedy quantifiers (*? +? ??) and atomic groups.
Opt for alternatives: Sometimes, I find that using string manipulation functions or built-in search functions can perform better than regex in certain tasks. It’s always worthwhile to compare alternative methods when optimising performance.
By keeping these best practices in mind while working with regex for SEO, I can increase the efficiency of my tasks and get the most out of regular expressions. Remember, practice makes perfect, so the more I work with regex, the better I become at crafting accurate and efficient patterns.
Common Regex Patterns and Their Usage
As someone who uses SEO, I’ve found that regular expressions (regex) can be a powerful tool for various applications. In this section, I’ll be sharing some common regex patterns and their usage in SEO, particularly in navigation and distribution of link equity and identifying duplicate content.
Navigation and Distribution of Link Equity
When it comes to website navigation, regex can be quite helpful in managing URLs and ensuring the smooth distribution of link equity. For instance, I often use regex when working with URL rewrite rules or when creating advanced segments on Google Analytics. Here are some common patterns I’ve found helpful to me:
Case-insensitive searches: Adding (?i) at the beginning of a regex pattern allows me to perform case-insensitive searches. For example, (?i)http would match both “HTTP” and “http”.
Wildcard matches: Using .* allows me to match any character (except line terminators) zero or more times. For instance, https://www.example.com/.* would match any URL under “example.com”.
Match specific characters: To match specific characters, I can use [abc] to match any single character from the character set. For instance, https://[w]{3}.example.com/.* would match any URL starting with “https://www.example.com/”.
Identifying Duplicate Content
Another area where regex is handy for me in the realm of SEO is in detecting duplicate content. Utilising regex, I can easily create rules and filters to pinpoint potential duplicates or patterns in content. Here are a couple of examples:
Matching exact word repetitions: To check for the repetition of a single word, I can use the \b\w+\b pattern followed by a space and \1 to match the same word. So, \b(\w+)\b \1 would identify repeated words like “the the” or “and and”.
Matching similar phrases: To detect similar phrases, I can use the \b(\w+)(?:\W+\w+){1,5}?\W+\1\b pattern. This would match phrases like “dog-friendly parks” and “parks for dog-friendly”, helping me spot potential duplicate content issues.
In conclusion, by incorporating these regex patterns, I’ve seen improvements in my SEO tasks such as managing link equity and spotting duplicate content. I hope that these examples inspire you to explore the power of regex for your own SEO needs. Just remember to always keep it brief, and accurate, and avoid any exaggerated or false claims.
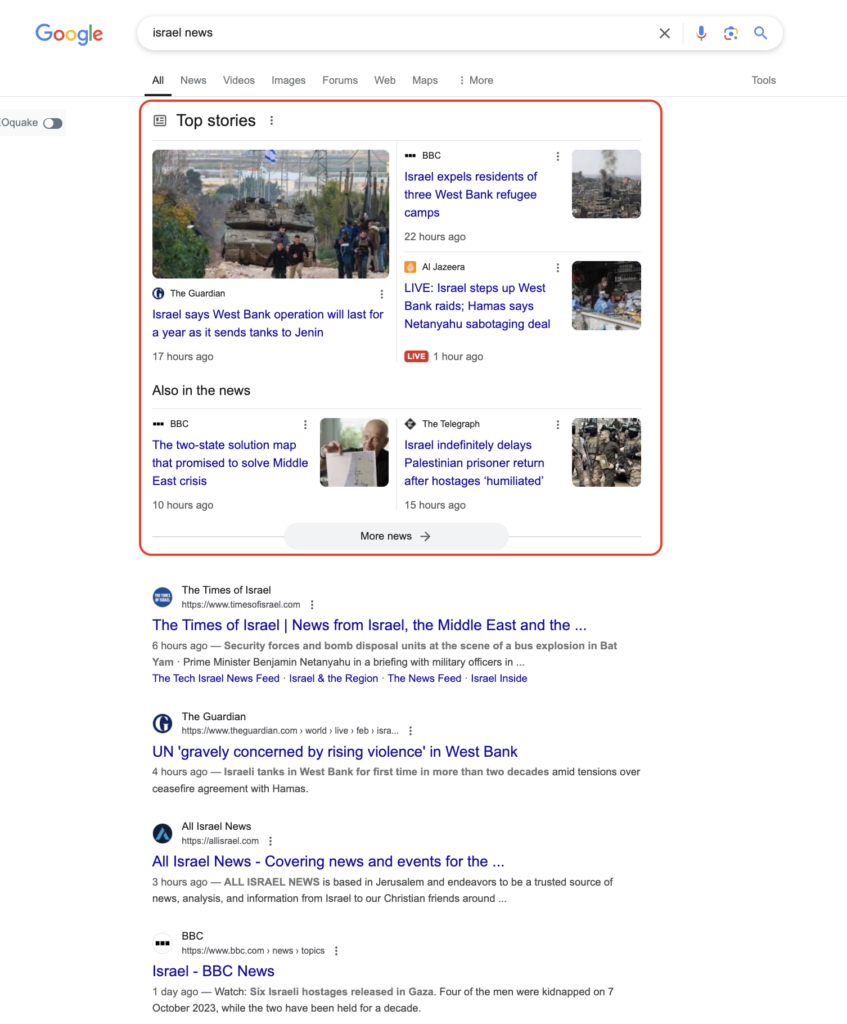
Appearing in Google’s Top Stories carousel is a great way to gain visibility for news content and drive organic traffic. However, Google doesn’t provide much data on clicks, impressions, or other performance metrics from this feature.
From a technical perspective, the Top Stories carousel is an AI-powered search results feature that showcases relevant and timely articles from a wide range of high-quality, trustworthy news sources.
What Python libraries do you need?
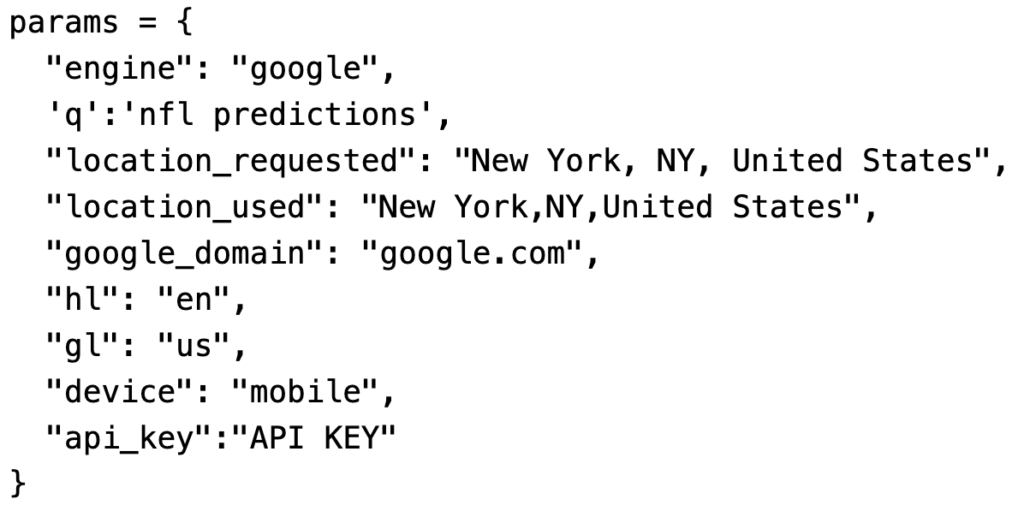
Setting Up the Parameters for the Request
To track results in Google Top Stories, you can use SERPapi, which offers 100 free requests per month—a good starting point for basic tracking. If you need a more in-depth, scalable solution, consider using dedicated tracking tools like StoryHawk.io, which I’m involved with.
To scrape the Top Stories carousel using SERPapi, sign up for a free account. Once registered, copy your API key and paste it into your script.
A handy feature SERPapi provides is the SERPapi Playground, where you can easily test and adjust your query parameters to fit your needs before running the script.
The current example is with the following parameters:
Search engine – Google
Query – “nfl news”
Location – New York
Domain – Google.com
Language – English
Region – US
Device – Mobile
Sending the request to SERPapi
To retrieve Top Stories data from SERPapi, you’ll need to send a request using Python’s requests library. The API response will be stored in the variable response, which will contain the JSON-formatted results.
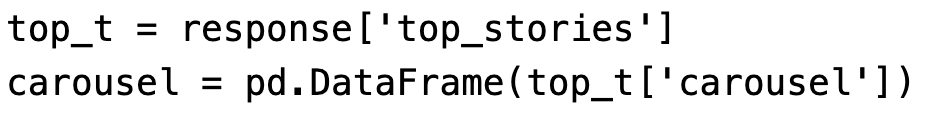
Filtering and Storing Top Stories Data in a Pandas DataFrame
The first step is to extract only the Top Stories data from the full API response, which contains information for the entire SERP (Search Engine Results Page). We’ll store this filtered data in a variable.
On mobile devices, multiple news carousels can appear, such as Top Stories, close topic (also about ... ), and Also in News. To ensure we're only working with Top Stories, we’ll create a second variable and store the extracted data in a Pandas DataFrame for easier analysis.
Adding More Data to the DataFrame from the API
To enrich the DataFrame with additional details from the API response:
The search query is stored in the "Keyword" column using the variable kwrd.
The device type is stored in a separate variable.
The date and time of the check are recorded in the "Date of check" column.
This ensures that each entry includes essential context, making it easier to analyse trends over time.
Exporting Data to Google Sheets
You can easily export your Pandas DataFrame to Google Sheets, making it accessible for further analysis or visualisation in Looker Studio. Below is a standard script to do this using Google Colab and the gspread library.
Exported data from the “Top Stories” carousel to Google Sheets
That is how should look your exported dataFrame/table with all needed values from the API for the query "trump news"
You can find this simple script in GitHub and or get in touch with me on X or LinkedIn
Scaling Up with StoryHawk.io
While this manual approach works well for individual tracking, it becomes challenging to scale for large publishers managing multiple news stories across different regions. That’s where StoryHawk.io comes in. Our tool automates Google Top Stories tracking at scale, providing real-time insights, historical performance data, and competitor analysis—all in one place. No need for manual API calls or data exports—StoryHawk.io does the heavy lifting, so you can focus on optimising your content strategy. 🚀